At the start of week Nifty opened Gap Up and formed big bullish marubozu candle on Monday and closed at above 18000 levels after making high of 18114. But Follow Up buying was missing on Tuesday , rather Nifty fallen on Tuesday, Wednesday & Thursday. But on Friday after making low of 17600 we witnessed relief rally in Nifty which took Nifty back above 17800 levels but failed to close above it and close came at 17784.
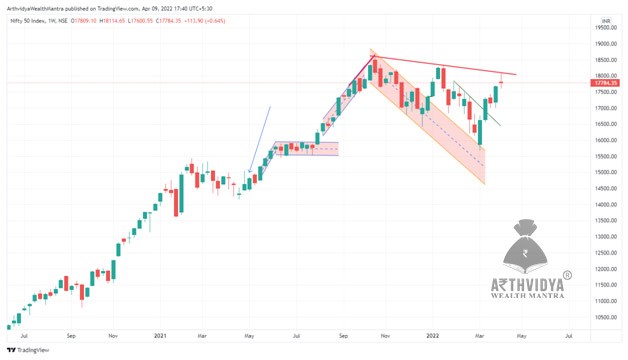
Weekly candle formed is Long Legged Doji, indicating Highly In decision. Nifty took resistance at Falling Trend line as shown in below image. Whole set up is Lower Top and Lower Bottom Formation. This is Third Lower Top so in coming 7-8 weeks we can expect lower bottom i.e. lower low below recent low of 15671 levels.
Nifty having stiff resistance at 18120 – 18200 levels. Fresh Buying only if Nifty Breaks & Sustains above 18200.
Weekly CHART OF NIFTY50
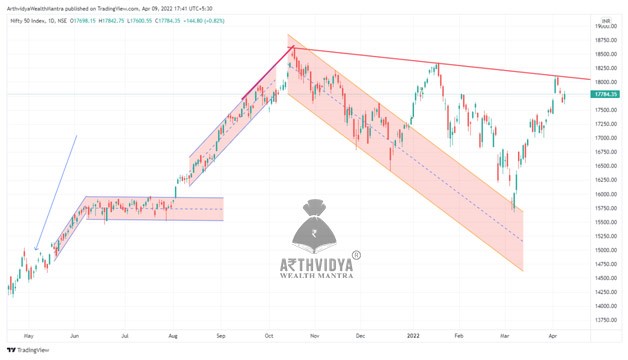
At the start of week Nifty opened Gap Up and formed big bullish marubozu candle on Monday and closed at above 18000 levels after making high of 18114. But Follow Up buying was missing on Tuesday , rather Nifty fallen on Tuesday, Wednesday & Thursday. But on Friday after making low of 17600 we witnessed relief rally in Nifty which took Nifty back above 17800 levels but failed to close above it and close came at 17784.
Weekly candle formed is Long Legged Doji, indicating Highly In decision. Nifty took resistance at Falling Trend line as shown in below image. Whole set up is Lower Top and Lower Bottom Formation. This is Third Lower Top so in coming 7-8 weeks we can expect lower bottom i.e. lower low below recent low of 15671 levels.
Nifty having stiff resistance at 18120 – 18200 levels. Fresh Buying only if Nifty Breaks & Sustains above 18200.
Daily Chart Of Nifty 50
BANKNIFTY
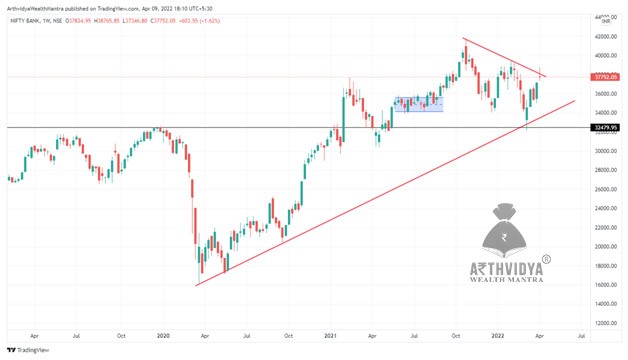
On Monday Banknifty too Opened Big Gap Up and Closed at 38635 and did managed to close above Falling Trend Line, but the same turned out False Break out in following 3 days till Thursday. It again went below the falling trend line, and on Friday we seen some relief rally but still it closed below falling trendline.
Weekly Candle formed is Long Legged Doji indicating High In-Decision. Fresh Buying only above this week’s high. Above 38765 one can go long.
Mondays(4th April 2022) Gap Up opening can still Act As support so watch out for 37200 levels for support, below which one can do fresh selling.
Banknifty Weekly Chart
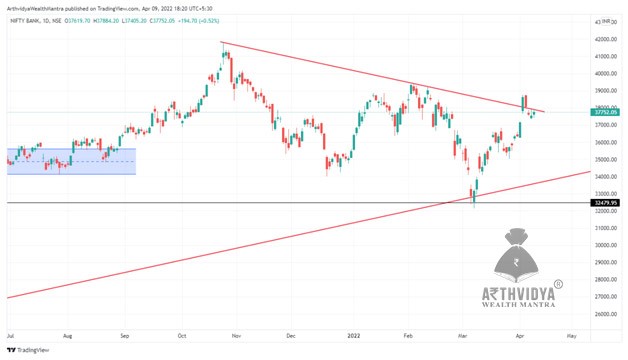
Banknifty Daily Chart
Stock Of The Week
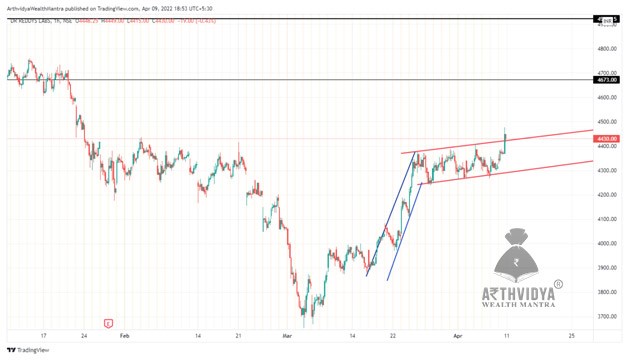
Dr. reddys Laboratories ltd.
Stock is seen breaking out of Bullish Pole and Flag Pattern. Price’s sustaining above previous swing highs from where it’s fallen most. We are of opinion that stock prices can go till 4550 – 4660 – 4700 – 4864 levels in coming week or 2 weeks.
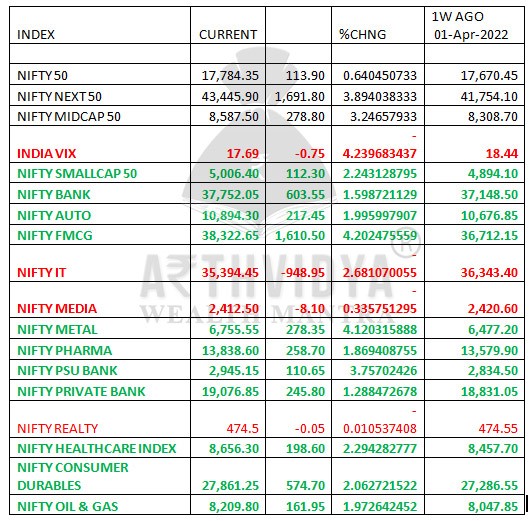
Major Indices at a glance
Majority of indices saw a positive week except Nifty IT & Nifty Media. Nifty FMCG was Top Gainer in this week, followed by Metal, PSU Banks & Nifty Auto. While India Vix is Down by 4.23% in this week indicating lesser volatility expectance in coming week.
Team Arthvidya Wealth Mantra
8484036329 / 79 / 87
www.arthvidya.in / info.arthvidya@gmail.com
Please like our FaceBook Page:
Subscribe to our YouTube Channel at :
Subscribe to our Telegram Channel at:
Disclaimer: This article is intended to be used for information and education
purposes only. It is very important to do your own analysis/study before making any investment decision based on your own personal circumstances. We are in no way related to the companies mentioned and discussed in any of our articles and we are not paid by any of these companies in any way.
Investment/Trading in securities Market is subject to market risk, past performance is not a guarantee of future performance. The risk of loss in trading and investment in Securities markets including Equities, Derivatives, Commodity and Currency can be substantial.